
Private schooling in Britain: a snapshot
Daniel Lilley, 24 February 2023

Summary
This briefing note provides a snap-shot of Britain’s independent schools, using data from the Independent Schools Council (ISC) annual census. The latest census (2022) shows that 544,316[1] pupils now attend ISC schools, up more than eight per cent in the last decade and a record high number. This is despite notable fee increases over time. Pupils at independent schools consistently represent about six per cent of all pupils, although this figure doubles to about 12 per cent for sixth formers.
The boarding school sector has seen a slight decline since 2015, with approximately 5,000 fewer boarders.[2] Pupils who board represent about 12 per cent of all pupils at fee paying schools (down from 14 per cent in 2015).[3]
In 1981 an average day school place cost approximately £4,200 (2021 prices);[4] in 2021 the same school place cost £15,600,[5] an increase of over 260 per cent during that period.[6] It would now cost almost three hundred thousand pounds (£293,000) to send a child to a private day school from four to 18,[7] and over half a million pounds (£520,000) to send a child to a private boarding (private day school from four, and then private boarding school from eight to 18).[8]
The average day school place in 2022 cost £5,315 per term, up 77 per cent since 2000.[9] A typical boarding school place will now cost £12,344 per term, compared to £6,824 (2022 pounds) in 2000, a rise of 66 per cent.[10] This indicates that school fees overall have likely seen an average real terms increase of between two thirds (66 per cent) and three quarters (77 per cent) since 2000.
Set alongside this is a 36 per cent increase in spending on means tested fee assistance and scholarships, from £340 million (2022 pounds) in 2011[11]to £479 million in 2021.[12] About one in 12 pupils receive some form of means tested fee assistance.[13] Schools spent almost £200 million on non-means tested scholarships in 2021[14] (although it is possible for some pupils to receive both means tested and non-means tested support). Almost five per cent of pupils received a bursary or scholarship worth 50 per cent or more of fees,[15] with one pupil in every 100 paying no fees at all.[16]
In the private sector, small classes are the norm, with nine pupils for every teacher,[17] compared to 18 pupils to every teacher in the state sector.[18]
More than two thirds of private schools are based in the south of England (71 per cent of schools based in southern regions).[19] London and the South East account for more than a third of independent schools (36 per cent) of schools.[20] Only 12 per cent of independent schools are based in the North of England[21] (one per cent of schools are based on the North East of England).[22]
British pupils make up about nine in 10 children at fee paying schools.[23] Non-British pupils are split almost evenly between those with parents who live in the UK and those who have parents abroad.[24] Pupils with parents living abroad represent about five per cent of all pupils at fee paying schools,[25] where they are most likely to be found in boarding schools (pupils with parents living abroad make up one in 10 boarders).[26] Non-British pupils make up one in six boarders overall.[27]
There has been a significant increase in the non-British pupils whose parents live in the UK, with numbers more than doubling from 11,300 in 2014 to 31,000 in 2022. These children make up about 5.7 per cent of pupils at fee paying schools.[28]
Pupil Numbers
In 2022, there were 544,316 pupils across the 1,388 ISC schools, this was up 8.2 per cent since 2013, when there were 503,132 pupils.
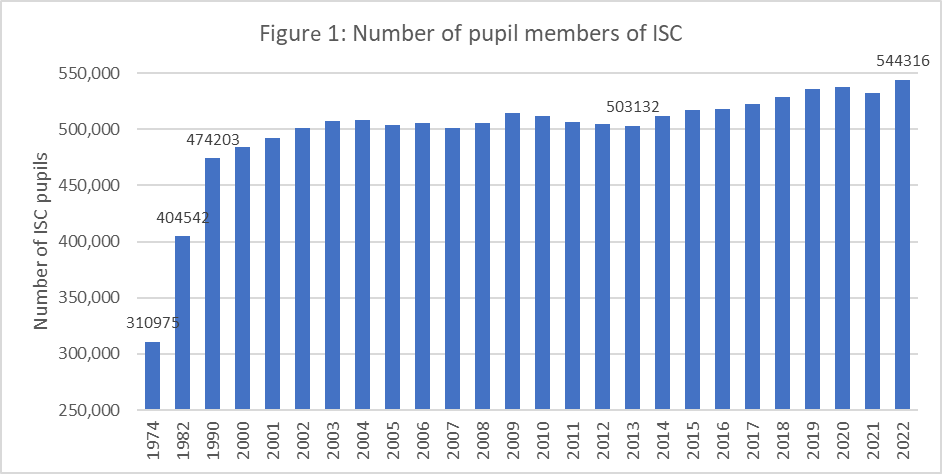
Figure 1 shows the number of pupils in ISC schools over time.

Figure 2 shows that ISC member pupils make up 6.05 per cent of all pupils in British schools; this percentage has been very steady for the last decade.
The percentage has risen slightly since the turn of the century, when they made up 5.8 per cent, but it has fallen very slightly in the last decade as ISC pupils made up 6.1 per cent of all pupils in 2013.
Although independent school pupils make up six per cent of all British pupils, this is not uniform across age groups.
National A-level results data[29] suggests that 12.2 per cent of all A-Level entries for 16-18-year-olds in 2021/22 were from independent schools.[30]
Data from gov.uk suggests that ISC students make up 4.7 per cent of junior students and 10.3 per cent of senior students (including sixth form).[31]
Boarding pupils
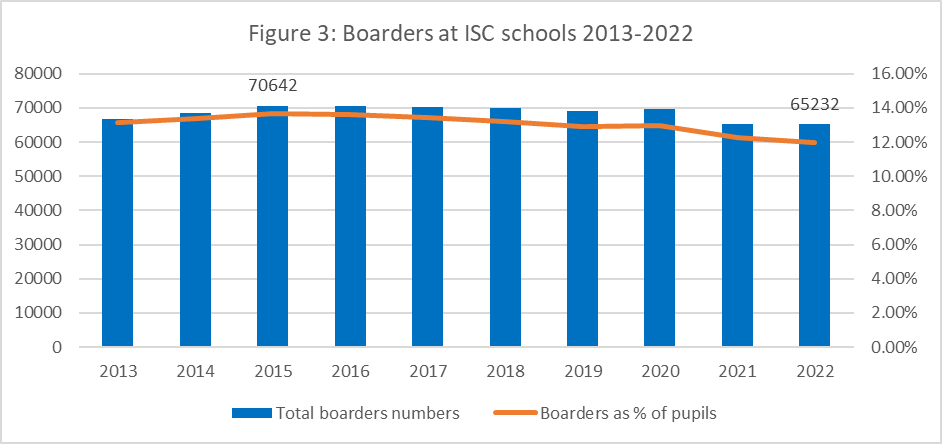
Figure 3 shows boarders make up a slowly shrinking percentage of ISC member pupils, from almost 14 per cent in 2015 to 12 per cent in 2022. The percentage figure displayed here is simply the number of boarders quoted by the ISC annual census each year as a percentage of the number of pupils quoted by the ISC annual census each year. This corresponds to 65,323 students in 2022, down from 70,642 in 2015.
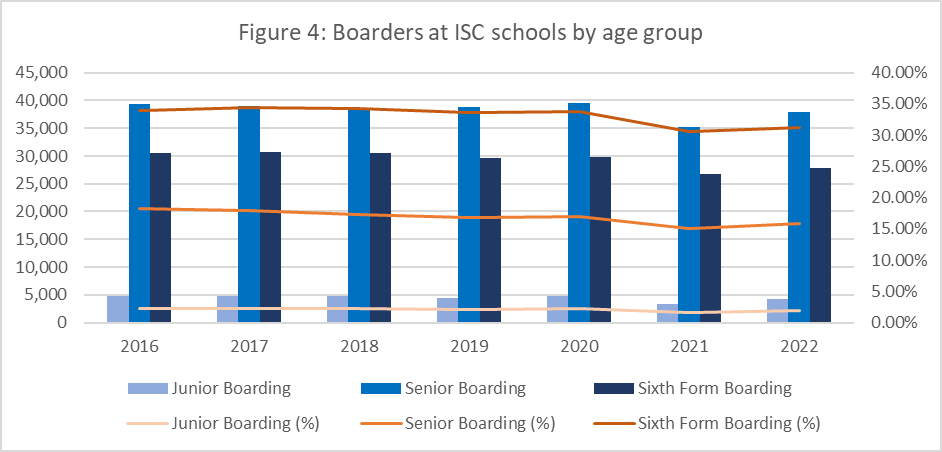
Figure 4 shows this result for sixth formers, senior pupils (excluding sixth form) and junior pupils.
Over a third (34 per cent) of ISC sixth formers board, compared to 18 per cent of senior ISC pupils and 2 per cent of junior pupils.
Senior (excluding sixth form) pupils make up the largest share of ISC boarders, at 39,284, or 60 per cent.
Types of school
The 1,388 ISC schools are varied; three simple ways of categorising independent schools are by the age of the pupils, whether they board and the sex of the pupils.
These have changed slightly in the last decade. Considering that the turnover is small – few schools join or leave the ISC each year – minor changes in these figures are notable.
In the decade from 2012 to 2022, there was a 13 per cent increase in the number of ISC schools[32].
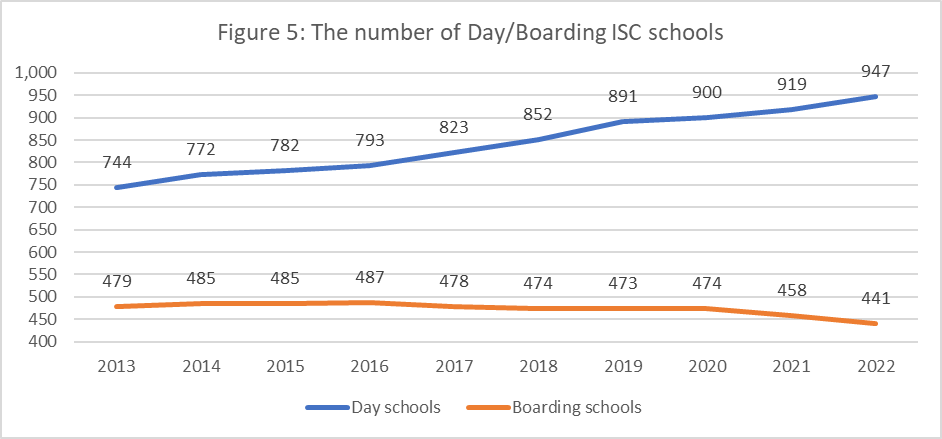
Figure 5 shows that between 2013 and 2022, there was an increase of 27 per cent in the number of day (no boarding) schools registered with the ISC and a decrease of 8 per cent in the number of schools registered with the ISC that offer boarding. A significant proportion of this rise will likely be explained by boarding schools becoming day schools.

Figure 6 shows that between 2013 and 2022, there was an increase of 9 per cent in the number of junior ISC schools, an increase of 18 per cent in the number of mixed-age ISC schools and increase of 18 per cent in the number of senior ISC schools. By age group, most ISC schools are junior schools, and less than a fifth (18 per cent) are senior schools. Mixed-age schools have become more common (from 34.3 per cent to 35.5 per cent).

Figure 7 shows that most ISC schools are co-educational, at 80.5 per cent. This figure has risen from 79.1 per cent in 2013. There are almost one and a half times as many girls only ISC schools as boys only ISC schools (45.5 per cent more).
Geography
More than two thirds of private schools are based in the south of England (71 per cent of schools based in southern regions).[33] London and the South East account for more than a third of independent schools (36 per cent) of schools.[34] Only 12 per cent of independent schools are based in the North of England[35] (one per cent of schools are based on the North East of England).[36]
Fees and fee contributions
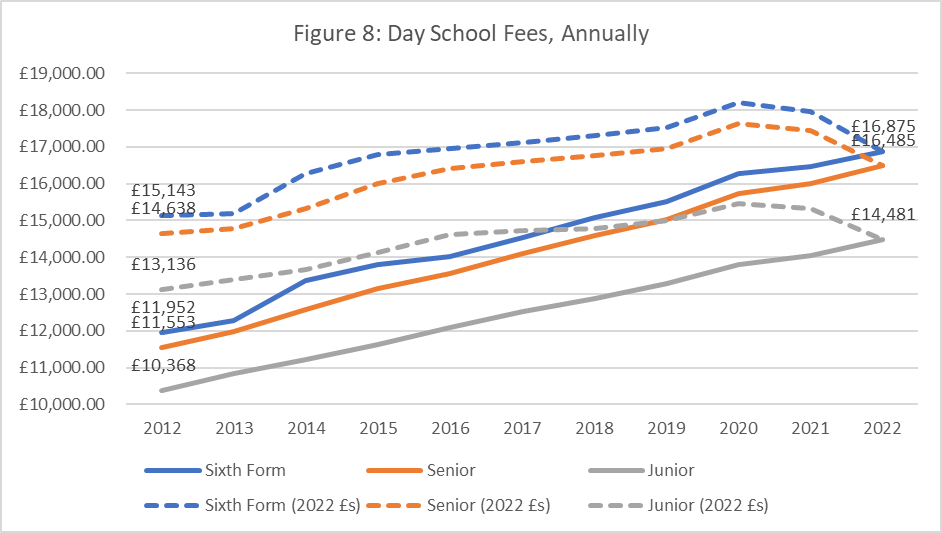
There has been an extraordinary rise in British private school fees over the last half-century. This is less clear over the last decade, although there are some signs of it. Figures 15 and 16 illustrate this clearly.
The average annual senior day school place in 2022 cost £16,485, up 13 per cent in real terms since 2012. The average annual sixth form day school place in 2022 cost £16,875, up 11 per cent in real terms since 2012. The average annual junior day school place in 2022 cost £14,481, up 10 per cent in real terms since 2012.
Fee growth rates are very similar across school types, even though fees are drastically different across school types.
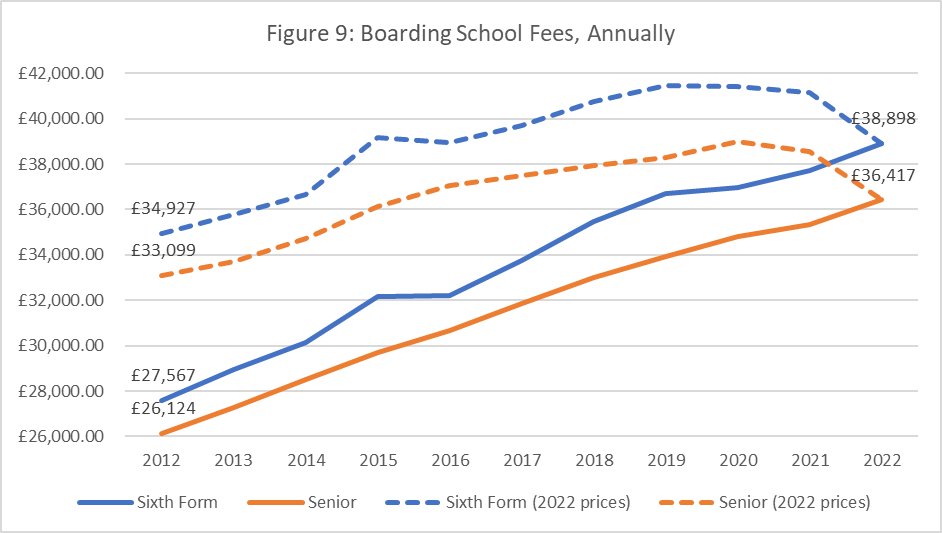
The average annual senior boarding school place in 2022 cost £36,417, up 10 per cent in real terms since 2012. The average annual sixth form boarding school place in 2022 cost £38,898, up 11 per cent in real terms since 2012.
To put these fee rises in context, UK household median income was £28,481 in 2011/12 and was £32,349 in 2021/22, a rise of 14 per cent. This means an average senior day school place (annual) increased from 41 per cent of median income in 2012 to 51 per cent in 2021/22.[37]
An average senior boarding school place (annual) exceed median household income by over £4,000. In 2012 this relationship was the other way around: median household income exceeded the average senior boarding school place by £2,357.
In 2022, the top fifth of households in Britain earnt £66,002, making senior day fees 25 per cent and boarding fees 55 per cent of their household income.
For the overwhelming majority of private school pupils, their parents are in the top 10 per cent income group.[38] Office for National Statistics data on gross annual pay by age [39] shows that for 40–49-year-olds at the 90th income percentile, private school has become roughly twice as expensive in one generation.[40]
In 1997 (roughly when today’s parents were at school), 40–49-year-olds at the 90th percentile earnt an average of £32,296 per year (in 1997 pounds) with average secondary day school fees of £4,182. This means fees were 12.9 per cent of earnings or 1/8th (1/7.75).
In 2022, 40–49-year-olds at the 90th percentile earnt on average £64,776.40 per year with average secondary day school fees of £16,654. This means fees were 25.7 per cent or gross income or 1/4th (1/4.14).
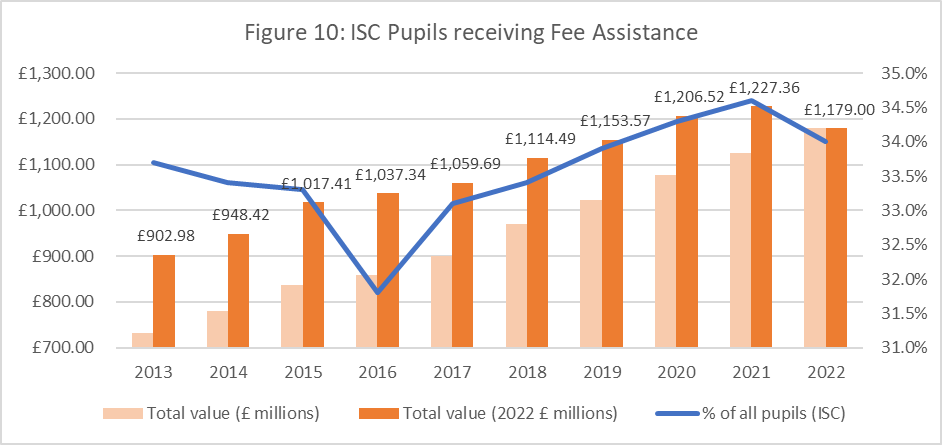
Fee assistance has risen notably since 2013, passing over both a third of pupils and one billion pounds of value within the last decade. The real increase in total value of fee assistance has risen by over £275 million (2022 pounds) and over 30 per cent, more than the increase in fees.
Ethnicity
The proportion of minority ethnic pupils has been rising rapidly in Britain for over a decade, both in the state maintained and independent sectors.
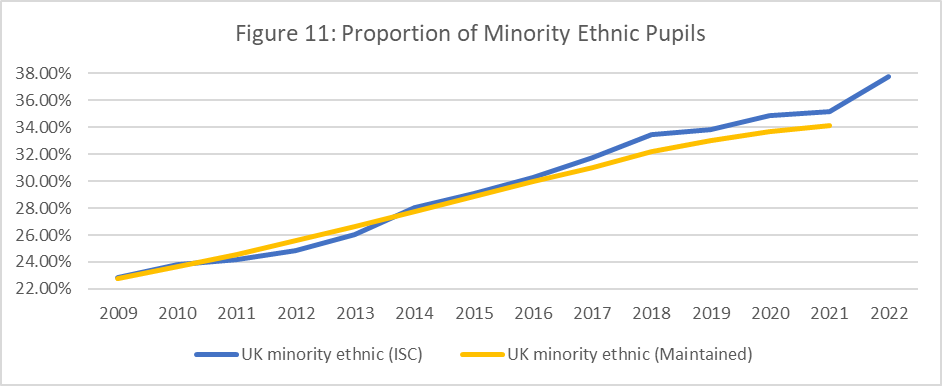
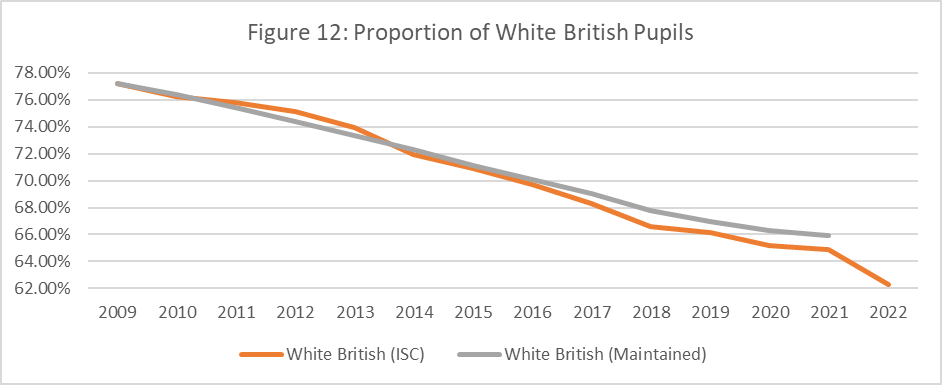
Figures 11 and 12 show the proportion (or, percentage) of pupils who were minority ethnic (Figure 11) and white British (Figure 12) for each of the last 10 years.
Independent schools went from 22.8 per cent minority ethnic in 2009 to 37.7 per cent minority ethnic in 2022; the maintained sector percentages went from 22.8 per cent in 2009 to 34.1 per cent (2021, there is currently no data for 2022). The 2021 figure for independent schools was 35.2 per cent – the ISC saw an increase of over 2.5 per cent in minority ethnic pupils between 2021 and 2022.
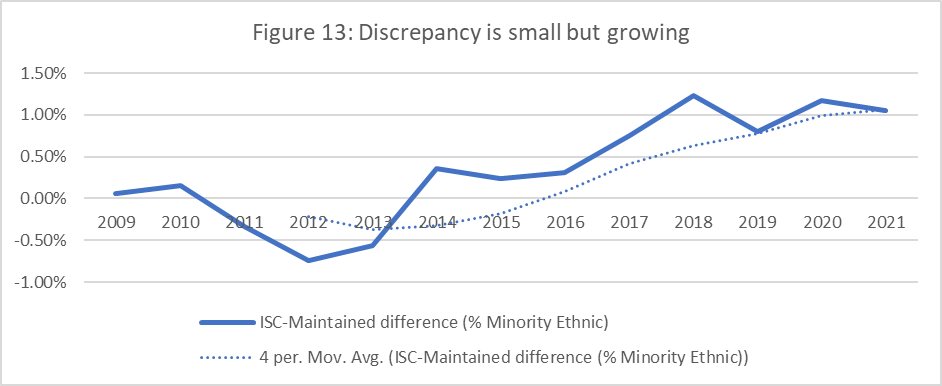
Figure 13 looks at the discrepancy between maintained and ISC schools for this. In 2012, minority ethnic pupils made up 0.75 per cent more pupils in maintained than ISC schools; in 2021, minority ethnic pupils made up 1.05 per cent more pupils in ISC schools than maintained schools.
Non-British pupils

Figure 14 shows that the number of non-British ISC pupils whose parents live abroad has fallen since 2014, from almost 36,000 to around 31,000. However, it has been gently rising since being just over 25,000 in 2018.
The number of non-British ISC pupils whose parents live in the UK has risen profoundly in the last decade or so, from 11,300 in 2014 to 25,100 in 2022. This is including the impact of the government’s response to Covid-19 on 2021 and 2022.
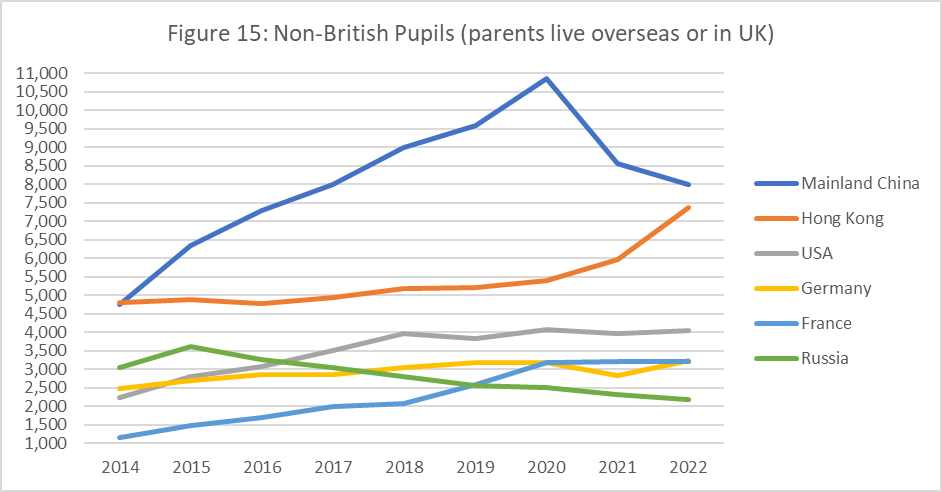
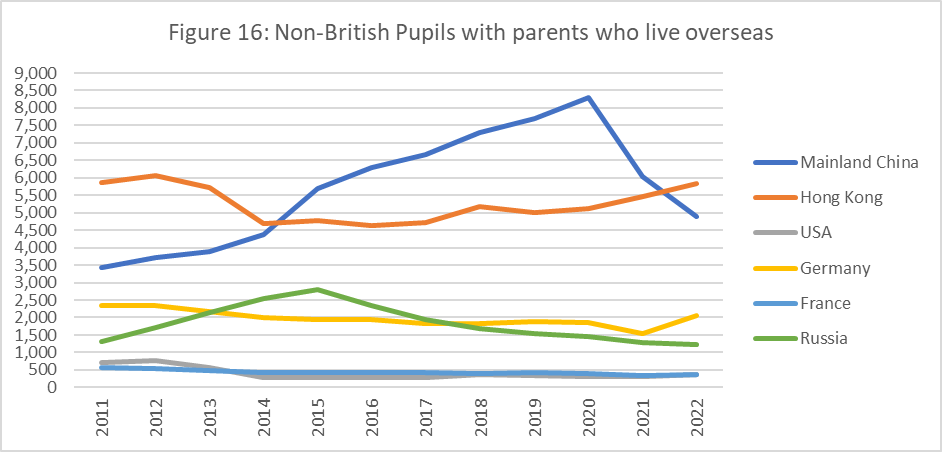
Figures 15 and 16 allow us to look at selected nations. These nations are the top five for number of pupils from that nation at ISC schools in 2022 (Mainland China, Hong Kong, USA, Germany, France) and Russia. Russia has been one of the top three main nations that non-British pupils have come from at ISC schools for most of the twenty-first century, but there has been a 39 per cent decline in Russian pupils since 2015. This result coincides with the Russian annexation of Crimea in the Spring of 2014.[41] There has generally been a growth of non-British pupils since 2015, from around 47,000 to around 55,000.[42]
Pupils from Mainland China increased hugely up to 2020, with the number of Chinese pupils whose parents live overseas increasing from less than 2,500 in 2007 to over 8,000 in 2020 – the overall number (including parents living in the UK) more than doubled between 2014 and 2020.
This trend has dramatically reversed in the last two years, with a fall from 10,864 Chinese pupils in 2020 to 8,002 in 2022. This fall is associated with Covid-19 restrictions.[43]
The number of pupils from Hong Kong has been increasing quickly for a few years, there were less than 5,000 in 2017 and were almost 7,500 in 2022.
Figure 16 illustrates that for pupils from the USA or France – two of the most common origins of non-British pupils – their parents are much more likely to live in the UK than pupils with parents from Mainland China, Hong Kong, Germany, or Russia.
Special Educational Needs and Disabilities (SEND)
The proportion of pupils who are characterised as having special educational needs or a disability (SEND) is higher for ISC members than the maintained sector – this is partly a result of different measurement across the two groups of schools. Figure 14 shows the number and fraction of ISC member pupils with SEND.
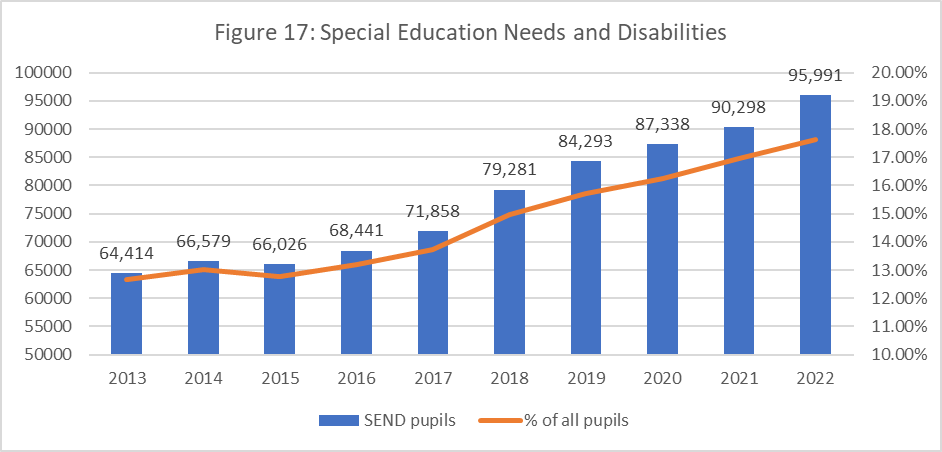
There has been a profound growth in the number and percentage of children at ISC schools with SEND, up half (49 per cent) in the last decade. It is difficult to confirm whether this is more a result of changes in rates of diagnosis or underlying rates of SEND.
The percentage of pupils across England with an EHC (Emotional Health and Care) plan or SEND support is 12.6 per cent,[44] it is 17.6 per cent across ISC pupils.
GCSE and A-level results
This data is not from the ISC annual census. As such, independent school pupils here includes slightly more students than there are ISC pupil members.
It is well-known that the most recent three years of data have been drastically affected by the government’s response to Covid-19. However, throughout the period, independent school pupils have received higher grades at GCSE and A-level than the national average (Figures 18 and 19). 2018/19 year was the last set of exams before Covid.
GCSE
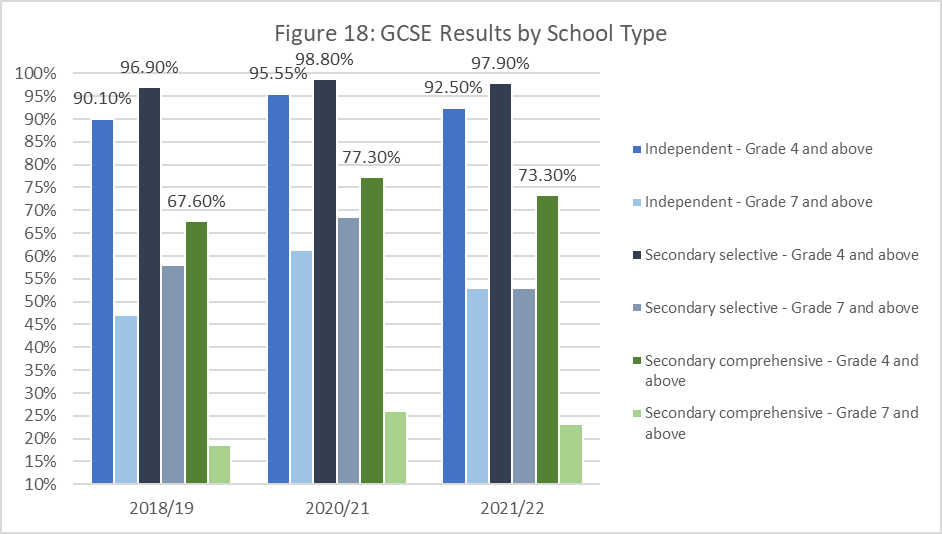
At GCSE, independent schools performed better than other school types in all three years, although worse than selective secondary schools.[45]
In 2018/19, 90 per cent of independent school GCSE grades were grade 4 or above, 67 per cent of comprehensive school grades were grade 4 or above. 97 per cent of selective secondary school grades were grade 4 or above.[46]
This pattern was more pronounced with the highest grades. Forty-seven per cent of grades achieved by independent school pupils were grade 7 or above. Nineteen per cent of comprehensive schools grades were grade 7 or above; and for selective secondary schools, 58 per cent of grades were grade 7 or above.[47]
In 2021/22, independent school pupils (53 per cent) were 2.3 times more likely than secondary comprehensive school pupils (23 per cent) to achieve a grade 7 or above on each GCSE. They had the same likelihood as pupils at selective secondary schools.[48]
A-Level

At A Level, independent schools performed better than all other school types in all three years, including secondary selective schools.[49] The difference between secondary comprehensive schools and independent schools has been smaller at A level than it has been at GCSE.
In 2018/19, 88 per cent of independent school A level grades were grade C or above, compared with 83 per cent of secondary selective school grades and 73 per cent of comprehensive school grades.[50]
Again, the difference between school types is clearer looking at top grades. Forty-five per cent of independent school A level grades were A or A*, compared with 36 per cent of secondary selective school grades and 20.5 per cent of comprehensive school grades.[51]
In 2021/22, independent school pupils (58 per cent) were almost twice as likely (1.9 times) as comprehensive school pupils (31 per cent) to achieve a grade A or A* on each A level.[52]
Daniel Lilley recently graduated from the University of Cambridge with a degree in economics.
[1] https://www.isc.co.uk/media/8421/isc_census_2022_final-v2.pdf, p3.
[2] https://www.isc.co.uk/media/8421/isc_census_2022_final-v2.pdf, p10.
[3] Ibid.
[4] https://www.isc.co.uk/media/6203/isc-annual-census-1982.pdf, p5 [avg. day school fee per term, adjusted for inflation (2021) is £1,420].
[5] https://www.isc.co.uk/media/8421/isc_census_2022_final-v2.pdf, p17, Fig 23 [avg. day school fee per term (2021) is £5,218.
[6] 1981 = £1,420, 2021 = £5,218; 276 per cent.
[7] Source: Civitas calculations, extrapolating previous decade of fee growth forwards for a day school student from 4 to 18. Seven years of junior school, five years of senior school and two years of sixth form.
[8] Source: Civitas calculations, extrapolating previous decade of fee growth forwards for a day school student from 4 to 18. Four years of junior day school, five years of junior boarding school, three years of senior boarding school and two years of sixth form boarding school.
[9] Day schools:2000 average termly day school place: £1,759 (adjusted for inflation to 2022: £2,945); 2022 average termly day school place: £5,218. Increase since 2000: 77.1%.
[10] Boarding schools: 2000 average termly boarding school place: £4,447 (adjusted for inflation to 2022: £7,446); 2022 average termly boarding school place: £12,344. Increase since 2000: 65.8%
[11] https://www.isc.co.uk/media/2460/2012_annualcensus_isc.pdf, p12 (£285 million, adjusted for inflation = £340 million).
[12] https://www.isc.co.uk/media/8421/isc_census_2022_final-v2.pdf, p18 (Fig 25) (£479 million).
[13] 46,517 pupils received means tested fee assistance in 2021.
[14] https://www.isc.co.uk/media/8421/isc_census_2022_final-v2.pdf p18 (Fig 25) (£198 million).
[15] 25,814 pupils received fee assistance of 50% or more in 2021
[16] 6,325 pupils received fee assistance of 100% or more in 2021
[17] https://www.isc.co.uk/media/8421/isc_census_2022_final-v2.pdf, p36 (Table 21)
[18] https://explore-education-statistics.service.gov.uk/find-statistics/school-workforce-in-england
[19] Total number of schools in London, South East, East and South West regions: 956; total number of schools in UK: 1351; 70.7%
[20] Total number of schools in London and South East regions: 494; total number of schools in UK: 1351; 36.5%
[21] Total number of schools in North East, North West and Yorkshire & Humber regions: 161; total number of schools in UK: 1351; 11.9%
[22] Total number of schools in the North East 16, total number of schools in UK: 1351; 1.1%
[23] https://www.isc.co.uk/media/8421/isc_census_2022_final-v2.pdf, p14
[24] Ibid.
[25] 24,871 ISC pupils whose parents live abroad and 544,316 pupils at ISC schools. https://www.isc.co.uk/media/8421/isc_census_2022_final-v2.pdf
[26] https://www.isc.co.uk/media/8421/isc_census_2022_final-v2.pdf, p29 (Table 9).
[27] https://www.isc.co.uk/media/8421/isc_census_2022_final-v2.pdf, p29 (Table 9, Table 10).
[28] https://www.isc.co.uk/media/8421/isc_census_2022_final-v2.pdf, p16.
[29] A level and other 16 to 18 results, Academic Year 2021/22 – Explore education statistics – GOV.UK (explore-education-statistics.service.gov.uk)
[30] A level and other 16 to 18 results, Academic Year 2021/22 – Explore education statistics – GOV.UK (explore-education-statistics.service.gov.uk) 283,754 16-18-year-old pupils received results from all schools and Further Education sector colleges, 229,600 pupils received results from all British schools, and 34,570 received results from all independent schools.
[31] Schools, pupils and their characteristics, Academic Year 2021/22 – Explore education statistics – GOV.UK (explore-education-statistics.service.gov.uk) there are 4,615,172 state funded primary students and 3,193,418 state funded secondary students, all pupils is counted as state funded plus independent here for simplicity.
[32] https://www.isc.co.uk/media/2460/2012_annualcensus_isc.pdf, p5″
[33] Total number of schools in London, South East, East and South West regions: 956; total number of schools in UK: 1351; 70.7%
[34] Total number of schools in London and South East regions: 494; total number of schools in UK: 1351; 36.5%
[35] Total number of schools in North East, North West and Yorkshire & Humber regions: 161; total number of schools in UK: 1351; 11.9%
[36] Total number of schools in the North East 16, total number of schools in UK: 1351; 1.1%
[37] Average household income, UK – Office for National Statistics (ons.gov.uk)
[38] Henseke, G., Anders, J., Green, F. and Henderson, M (2021). “Income, housing wealth, and private school access in Britain.” Education Economics 29(3): 252-268, Anders, J., Green, F., Henderson, M., Henseke, G. (2020) Determinants of private school participation: all about the money? Anders et al BERJ Private Schools (ucl.ac.uk)
[39] Earnings and hours worked, age group: ASHE Table 6 – Office for National Statistics (ons.gov.uk) it should be noted that in order to standardise across the two editions (1997 and 2022) of the data, annual pay has been estimated using the weekly pay figures, for all adults aged 40-49.
[40] The average age of mothers giving birth was just over 26 in 1997, we have rounded to 25 years for accessible data, the illustration would be even stronger (although admittedly not much) with an additional year or two.
[41] https://www.gov.uk/government/speeches/seven-years-of-illegal-occupation-of-crimea-by-the-russian-federation-uk-statement
[42] https://www.isc.co.uk/media/8387/isc_census_2022_final.pdf
[43] https://www.isc.co.uk/media/8387/isc_census_2022_final.pdf, p18
[44] Special educational needs in England, Academic Year 2021/22 – Explore education statistics – GOV.UK (explore-education-statistics.service.gov.uk)
[45] Guide to GCSE results for England, summer 2022 – GOV.UK (www.gov.uk)
[46] Guide to GCSE results for England, summer 2022 – GOV.UK (www.gov.uk)
[47] Guide to GCSE results for England, summer 2022 – GOV.UK (www.gov.uk)
[48] Guide to GCSE results for England, summer 2022 – GOV.UK (www.gov.uk)
[49] https://analytics.ofqual.gov.uk/apps/Alevel/CentreType/
[50] https://analytics.ofqual.gov.uk/apps/Alevel/CentreType/
[51] https://analytics.ofqual.gov.uk/apps/Alevel/CentreType/
[52] https://analytics.ofqual.gov.uk/apps/Alevel/CentreType/