
Potential post-Brexit tariff costs for EU-UK trade
Justin Protts, October 2016

Summary
- Our analysis shows that if the UK leaves the EU without a trade deal UK exporters could face the potential impact of £5.2 billion in tariffs on goods being sold to the EU. However, EU exporters will also face £12.9 billion in tariffs on goods coming to the UK.
- Exporters to the UK in 22 of the 27 remaining EU member states face higher tariffs costs when selling their goods than UK exporters face when selling goods to those countries.
- German exporters would have to deal with the impact of £3.4 billion of tariffs on goods they export to the UK. UK exporters in return would face £0.9 billion of tariffs on goods going to Germany.
- French exporters could face £1.4 billion in tariffs on their products compared to UK exporters facing £0.7 billion. A similar pattern exists for all the UK’s major EU trading partners.
- The biggest impact will be on exports of goods relating to vehicles, with tariffs in the region of £1.3 billion being applied to UK car-related exports going to the EU. This compares to £3.9 billion for the EU, including £1.8 billion in tariffs being applied to German car-related exports.
This purpose of this analysis is to determine the potential tariff implications for both UK and EU exporters in the event a free trade deal has not been reached by the time the UK exits the European Union (some commentators have questioned the extent to which tariffs are felt by exporting companies, suggesting that their impact is in fact on consumers. A response to this point has been added below.)
The study aims to achieve this by providing estimates for the level of tariff costs that could be introduced if trade between the UK and EU was conducted under WTO Most Favoured Nations (MFN) terms, on the assumption the UK leaves the EU customs union and has no new free trade deal. Doing so allows us to examine the importance of continued free trade for both the UK and our EU trading partners and so highlights the relative strengths for and pressures on both sides in upcoming negotiations.
The findings of our analysis highlight the importance of a trade deal for both the UK and for EU countries.
The analysis uses import data from 2015, combined with the EU’s MFN tariff schedule, to provide the most up-to-date estimate of tariffs that would be payable on UK-EU trade if our trade continued under the ‘WTO-only’ option. This study is ‘static’, i.e. it does not take into account the elasticity of sales in response to tariff-induced price increases. However, using the most recent annual data, it provides an indication of the relative magnitude of tariff costs and hence the pressure to ensure the UK and EU secure a trade deal.
Tariffs are not the only factor that could damage in the absence of a comprehensive trade deal. Regulatory and other non-tariff barriers (NTBs) could increase the cost of trading goods between the EU and UK and make it harder for exporters selling goods in either direction. These NTBs become increasingly significant as tariffs are reduced. However, with the assumption that the EU and UK would both maintain the same initial tariff schedules, and given the UK is currently compliant with all EU regulation, preventing the introduction of tariffs must be the first and potentially most significant step in the process of achieving continued free trade.
As such, realising the potential cost of re-introducing tariffs to trade between the UK and most of Europe is the first step in making the case for a trade deal that will allow both EU and UK citizens to benefit from continued tariff-free trade across the continent.
The change in trading terms (including the potential introduction of tariffs), UK trade policy and the relative values of sterling and the euro will all influence the level of trade. These issues are not covered by our data analysis but are discussed in the note.
Estimating the level of tariffs relating to UK-EU trade
By country
Though negotiations on the future EU-UK relationship will take place at an EU level, it is vital to remember that 28 different countries (including the UK) will have to approve any new EU-UK trade deal. Further still, the 27 national governments of the EU will be providing direction for the negotiations and each working to strike a deal which will protect the interests of their electorate. The same of course applies to the UK.
As such our analysis draws on national data to show the level of tariffs that could have been applied to EU-UK trade had goods been subject to the EU’s current MFN tariff regime.
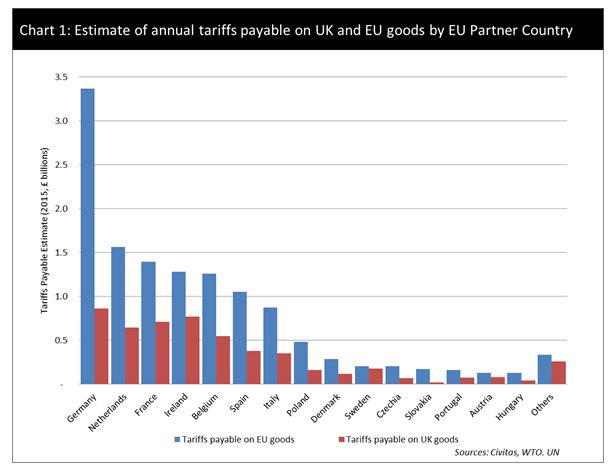
The analysis is summarised in Table 1. For imports, columns 2 and 5, the country with the higher value (i.e. has a trade surplus) is shaded red. For potential tariff costs, columns 3 and 6, the ’loser’ country (i.e. the one whose exporters suffer higher total costs) is shaded red. Exporters to the UK from 22 of the 27 remaining EU member states would face higher tariff costs on their goods than UK exporters would face when selling goods in the other direction.
Those 22 include all of the UK’s major trading partners, with Germany facing a potential tariff barrier of around £3.4 billion and France and Ireland seeing a barrier of £1.4 billion and £1.3 billion respectively. This stands in comparison to UK exporters who would see tariffs of £0.9 billon on goods going to Germany, and £0.7 billion and £0.8 billion on exports to France and Ireland, respectively.
This pattern is repeated with all the UK’s major EU trading partners. In total the EU faces a potential of having to deal with the cost of £12.9 billion in UK tariffs, an average levy of 5.8%, and UK exporters face EU tariffs of £5.2 billion, an average of 4.5%.[1]

This is a reflection of the current balance of trade between the EU and the UK. As a net importer of EU goods the UK government would potentially collect over twice as much in tariffs on EU goods than would be levied on UK goods going to the EU.
Of course, a high-level aggregate approach of this nature obscures the direct impact on the ground. It is unlikely to provide much comfort to a British exporter facing higher costs to learn that overall the UK is a net ‘winner’ or to be told that his overseas competitors are left in an even worse position. However, the £12.9 billion in additional revenues would provide the UK government with significantly more funds than our EU counterparts to invest in boosting the UK economy, or to implement on ‘mitigation’ measures to counteract the impact (within the bounds of WTO rules).
That said, these tariffs would be a cost that would be damaging to both UK and EU exporters and should put pressure on both sides in the negotiations to achieve a deal that is in the interest of their own economies.
The value of tariffs payable on EU and UK goods is estimated by applying the average tariff for each 6-digit HS (Harmonized System) code to the value of goods traded between the UK and each of its partner EU countries.[1] The tariff (or customs duty) paid on goods imported to the EU is calculated by applying the tariff to the value of the good imported.[2] Chart 1 breaks down the potential tariff burden for exporters in the EU countries exporting to the UK (in blue) and compares it to the tariff burden facing UK businesses exporting to each EU trading partner (in red).[3]
By industry
Country-by-country estimates and EU-UK comparisons provide a broad comparison that makes it clear there will be an economic impact for all current EU members if a trade deal that allows continued tariff-free trade is not agreed.
A closer look at the difference across different industries allows us to see more clearly the pressure points for upcoming negotiations. Tables 2 and 3 highlight the biggest losers in both the UK and EU, by value and by percentage, in the event tariffs are introduced.

Table 2 shows that manufacturers of vehicles and parts would be set to incur the most costs in absolute terms. Applying tariffs to the trade values in 2015 would see UK vehicle (including parts) manufacturers dealing with the cost of £1.3bn in tariffs on EU bound goods. This compares with exporters in the remaining EU countries having to deal with the consequence of £3.9bn in tariffs on UK bound goods. Germany alone would see vehicle goods facing £1.8bn in UK tariffs.
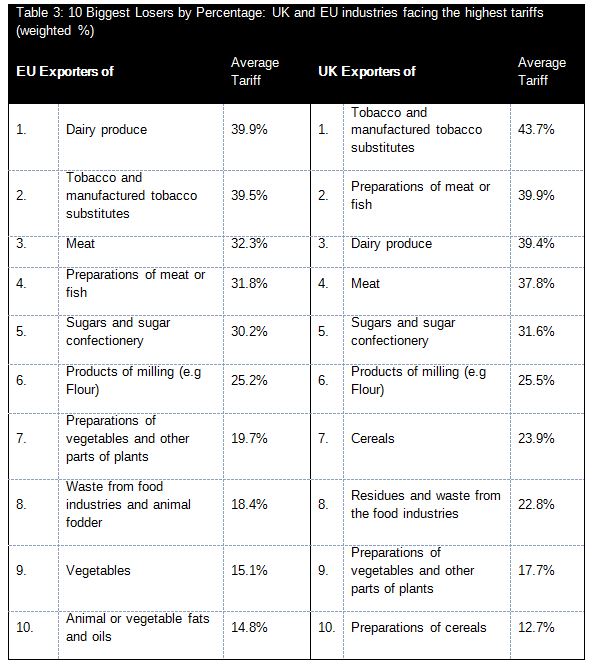
Beyond vehicles, it is the food and agricultural industries whose exports would suffer the most from the introduction of tariffs, with meat, dairy and other agricultural products featuring heavily in the top ten biggest losers. This is more evident when you look at the industries that will face the highest tariffs in percentage terms. This is important, as a high absolute amount of tariff costs might simply be a reflection of higher sales volumes.
Table 3 shows the weighted average tariff rates by product type, to indicate the significance of tariffs for each exporting sector. The biggest losers for both the EU and UK are all agricultural and food products. Tariffs of around 40 per cent could have a significant effect on agricultural exports and in the event they were introduced, there would likely be a significant drop in trade between the EU and UK. The introduction of tariffs on any goods traded between the UK and the rest of the EU could significantly damage the business of exporters.
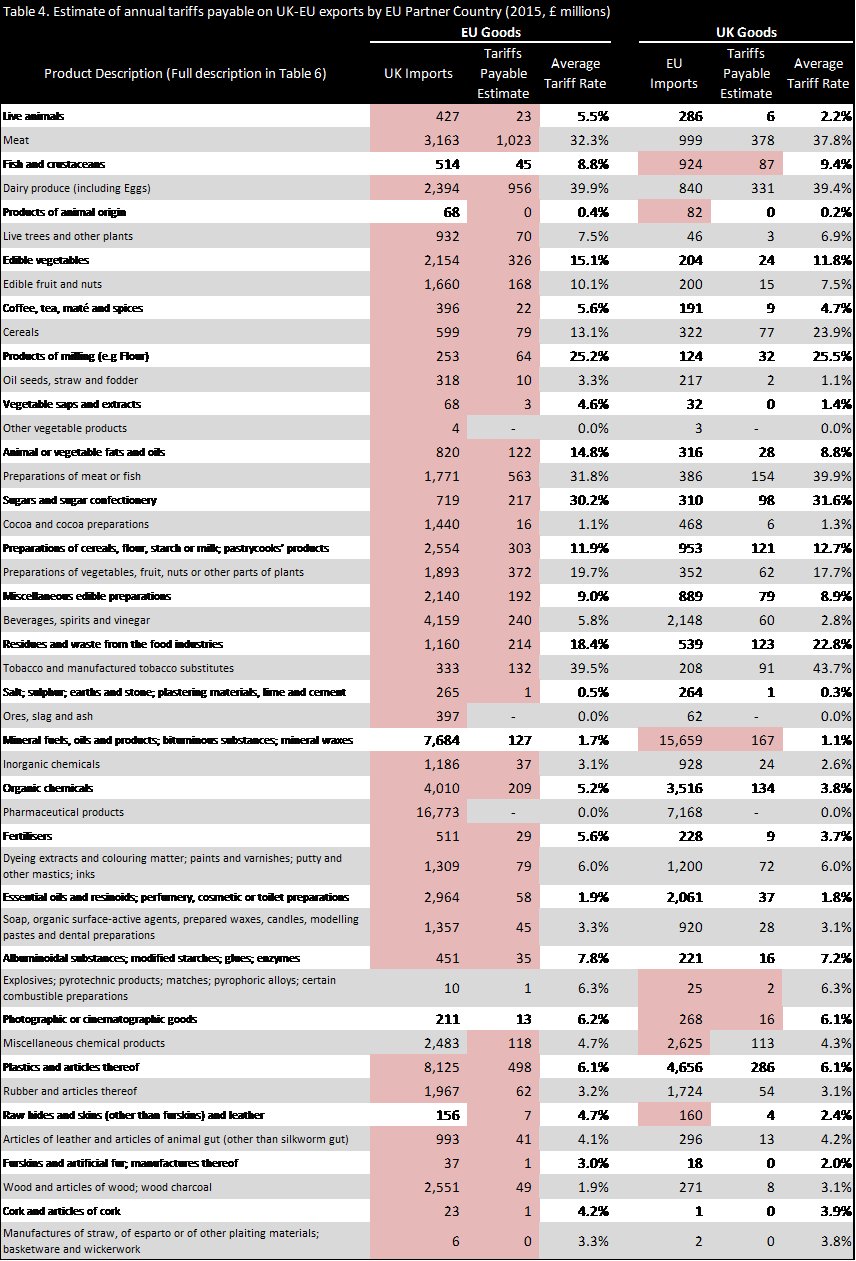
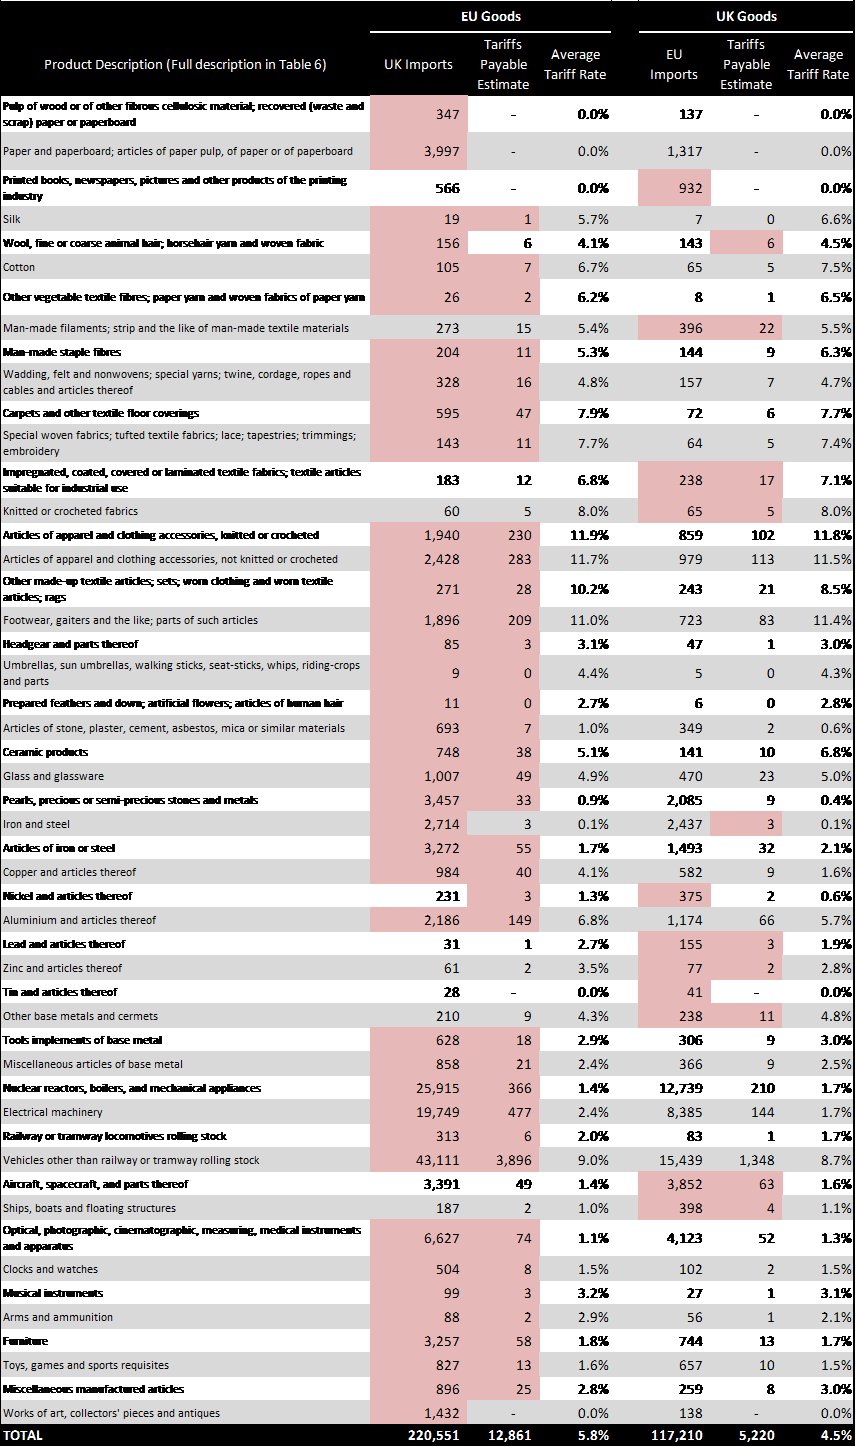
A more detailed breakdown of the aggregate UK and EU figures into the different types of products, according to the World Customs Organisations Harmonised System 2-digit codes, is included in the Appendix along with tables showing the top ten biggest losers by value for each EU country. This analysis allows us to see that for only 14 of the WTO 97 product groups listed in Table 4 (in the Appendix) will the UK government receive less in tariff revenues than all governments in the EU combined. This again highlights the fact that the remaining EU 27, not just the UK, has a great deal to lose if a deal is not struck to continue free trade across the continent.
Looking further
The static nature of this study means that we have not adjusted for the change in demand should tariffs be introduced. Normally increases in prices would see demand for products fall. A fall in sales would likely lead to lower tariff income.
The UK will have the chance to adjust for these changes. It has the opportunity on leaving the EU to alter its tariff schedule in a manner that is more favourable to UK businesses, reducing tariffs on input products for UK manufacturers and other products that are not manufactured in the UK, while keeping tariffs on goods that can be manufactured in the UK that are perhaps not yet competitively produced. Further still, the depreciation of sterling, although it will lead to increases in import prices, will reduce the cost of buying goods from the UK. Both these factors will allow the UK economy to adjust for the introduction of tariffs if there is no trade agreement.
The EU does not have the opportunity to easily change its tariff schedule and has seen the euro rise against sterling. This will put pressure on EU manufacturers who export to the UK. The introduction of tariffs therefore will be harmful to both the remaining EU countries and the UK, but as an independent country the UK at least will have the ability to adjust.
Beyond the European Union
As it seems to be the case that the government is planning to leave the single market and customs union our trading relationship with third countries will be dependent on the success of UK diplomacy rather than our future relationship with the EU. It therefore makes sense to focus initially on the potential tariff impacts for the UK and EU countries only.
There is a case for looking at tariffs impacts for third countries with which we have an EU trade agreement currently, but estimates will be highly speculative.
Appendix
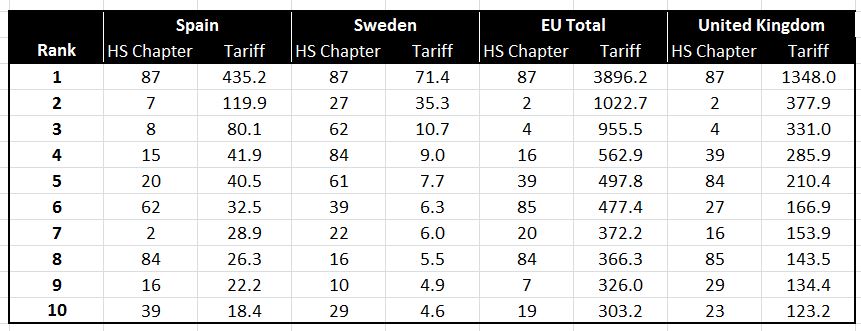
Table 4 breaks down the import figures and potential tariff costs into aggregates by WTO HS chapter. In the import columns, if imports by the UK of EU goods are greater than the corresponding imports by the EU of UK to goods then the value is shaded red, and similarly if imports by the EU of UK goods are greater than imports by the UK of EU goods. This represents a trade surplus for EU or UK goods respectively. For the tariff cost columns, the value of tariffs which is higher by product group (either for EU or UK goods) is shaded red, representing a higher tariff b urden in absolute monetary terms.
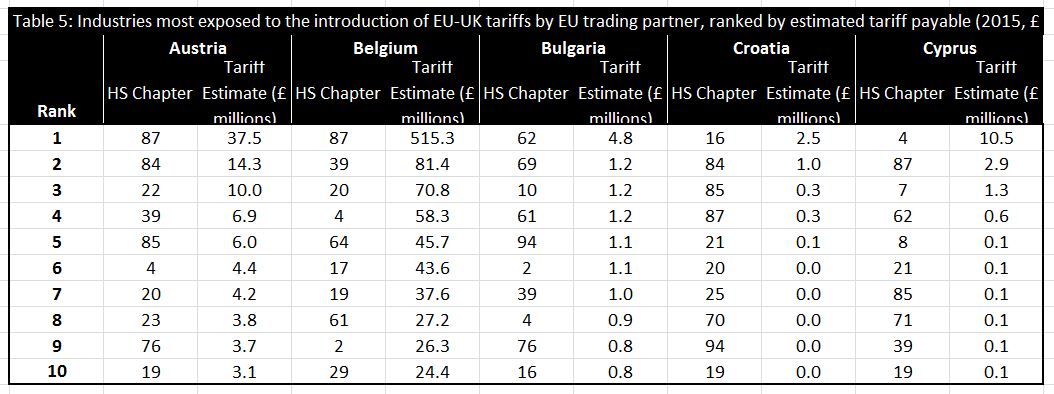
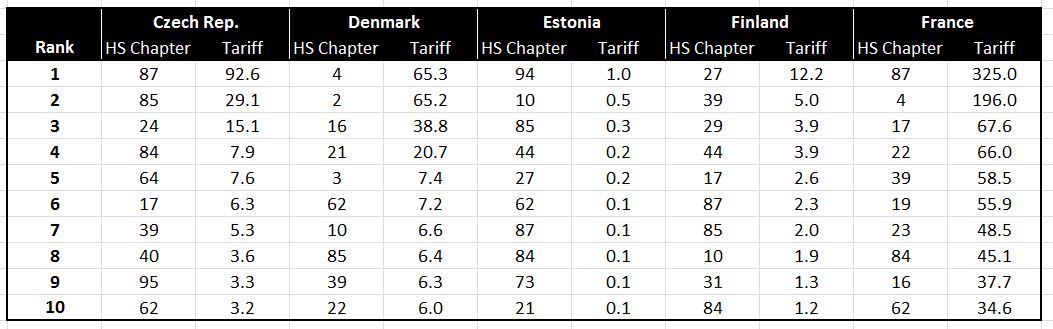
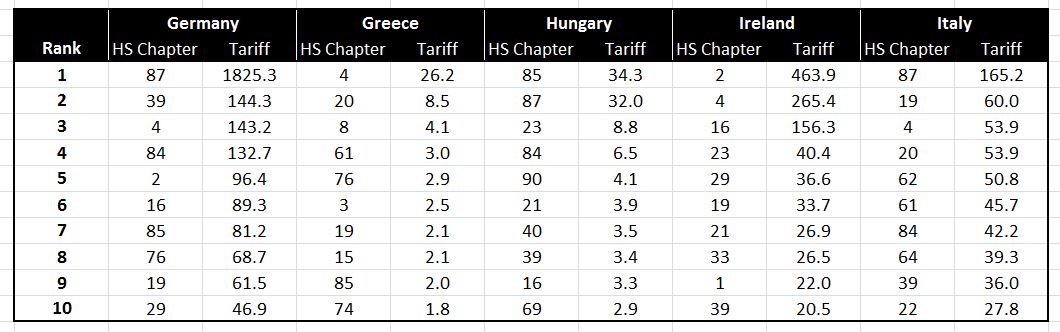
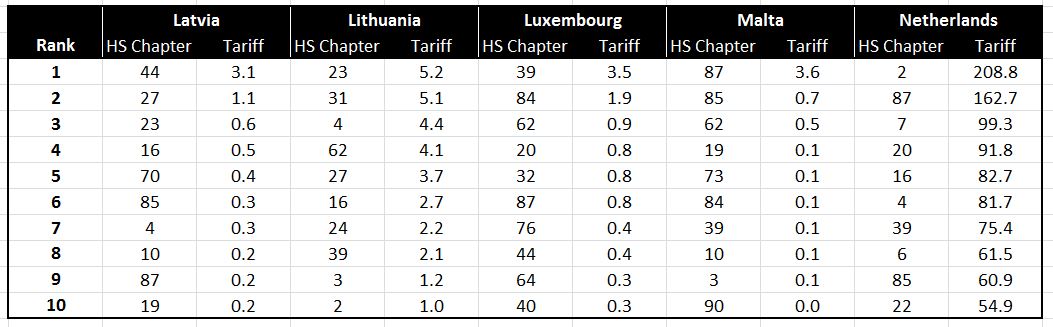
Tables 5 and 6 show the top ten product groups exposed to tariffs in absolute monetary terms for each EU country, including the UK. Table 5 shows, for each country, the HS chapter (product group) and the tariff cost estimate in millions of pounds. Table 6 lists the full description for each HS chapter number.

Response to critics (added 1 November, 2016)
Some commentators on the first edition of this paper noted that we had not explicitly stated that consumers ultimately pay import duties. The purpose of the analysis, as stated in the opening paragraph, was to determine the potential tariff implications for both UK and EU exporters in the event a free trade deal had not been reached by the time the UK exits the European Union. Despite suggestions otherwise, the report does not make an assumption tariffs are paid by exporters.
The failure to explicitly state the fact that tariffs (or customs duties) are paid by the importer is only a result of a failure to realise it needed stating. The fact that tariffs are paid by the importer and, as stated, the value of the tariff is calculated based on the import value (the value the buyer has paid for the good) is not forgotten, and it is the reason the data published was based on import values (See footnote 3). However, the impact of tariffs will be shared by both; the consumer, who will either cover the tariff cost by purchasing the good at a higher price or choose not purchase the product (potentially buying an alternative); and the exporters, who may find that the tariff leads to a fall in demand or who may have to adjust their business model in a way that absorbs the cost and allows them to sell the product at a competitive price despite the tariffs.
The simplest method of looking at the relative impact for exporters for tariffs is to see what tariffs will have to be paid on their goods. The exact impact of the tariffs for exporters will vary by product due to varying levels of demand and the availability of substitute products. These variations, among others, mean it would likely be an impossible task to accurately model such an impact at an aggregate level, nationally or by product type.
[1] Comtrade Data: UK Imports (‘Goods’, ‘Annual’, ‘HS12′,’2015′,’United Kingdom’,’All’,’Imports’,’AG6 – All 6-digit HS2012 commodities’) and EU Imports (‘Goods’, ‘Annual’, ‘HS12′,’2015′,’All’,’United Kingdom’,’Imports’,’AG6 – All 6-digit HS2012 commodities’): http://comtrade.un.org/data/; EU MFN AVE Tariffs for 2015: ITC MACMap AVE Tariffs (World Tariff Profile Method): http://www.macmap.org/QuickSearch/FindTariff/FindTariff.aspx; Comtrade GBP/USD 2015 Imports Exchange Rate: 1.528854 http://comtrade.un.org/db/mr/daExpNoteDetail.aspx?r=826&y=2015
[2] The HS Code is from the World Customs Organisation harmonized system for the classification of goods: http://www.wcoomd.org/en/topics/nomenclature/instrument-and-tools/hs_nomenclature_2012/hs_nomenclature_table_2012.aspx; the value of goods by partner country and HS code is taken from the UN Comtrade database: http://comtrade.un.org/data/
[3] The value of the good is calculated as the value payable to the seller, so includes the cost of transport and packaging. The tariff for goods is applied using tariff codes based on the Harmonized System code which is an international system which identifies products by a code. Most tariffs are calculated as a percentage of the value of the good (ad valorem tariffs). However, a number of goods are calculated depending on the weight. Our estimate uses average tariffs calculated at the 6-digit HS code level. The tariffs are calculated as simple means at a 6-digit level. For the non-AV tariffs an AV equivalent (AVE) figure is used in calculating the 6-digit average. The AVE figures are from the ITC MACMap using the World Tariff Profile methodology (http://www.macmap.org/SupportMaterials/Methodology.aspx#method_B11). These AVE estimates are provided at a national code level and are then included in the 6-digit HS code average, these 6-digit averages are multiplied by the value of goods imported (from each EU country to the UK and from the UK to each EU country) which fall into that 6-digit category. These are the figures that are then used in the report and which are used to provide the weighted averages for the 2-digit HS chapters.
For comparison, the same research was done using export figures and, though subtle differences between the data exist, the findings remain broadly unchanged with EU goods imported to the UK seeing an estimated £12.9 billion in tariff and UK goods imported to EU countries seeing a total of £5.6 billion in tariffs.
[4] The 15 EU members that can be expected to suffer the greatest tariff impacts are included separately with the remaining 12 combined in the ‘Other’ columns.
About the Author
Justin Protts is a Civitas Research Fellow. He can be emailed at justin.protts@civitas.org.uk and tweets @Justin_Protts.
Download PDF